Secure, efficient, and convenient: Energy management can be that simple
Kieback&Peter’s CO₂ roadmap shows how to manage the balancing act between climate protection and cost reduction in building operation. It is based on the Qanteon software, which combines an energy management system (EMS) and a building management system (BMS). Qanteon Hub is its new face and features two new services – Dashboard and Insights.
What the new Qanteon services can do
Qanteon’s services provide a new approach to complete consumption, cost and emissions transparency for our customers. They lay the foundation for intuitive and sustainable energy management and can help prevent climate change.
Qanteon Hub
One click, three goals: Central platform for energy management

Digitalizing buildings can reduce energy costs by around 50% in comparison with conventional building operation. The CO₂ roadmap relies on the tried-and-tested Qanteon system to implement its measures for this; its EMS is certified according to ISO 50001.
Where building operations are concerned, both efficiency and maximum reduction of energy costs and CO₂ emissions are important issues for you as an investor, entrepreneur, planner, operator or facility/energy manager. The new web-based application Qanteon Hub lets you achieve all three goals directly and lays the foundation for convenient efficient energy management at your company.
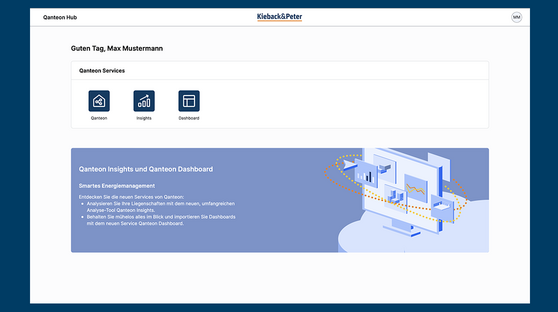
The platform is centralized and provides three accesses in one: to the actual Qanteon management software and to the two new services Qanteon Dashboard and Qanteon Insights. The main login for all Qanteon services takes place via Qanteon Hub – for the current applications and the ones planned for the future. The new interface lets users quickly and easily switch back and forth between the different applications. That is how Qanteon Hub makes efficient, centralized control of energy management measures possible.
>>
Qanteon Hub provides a central platform for effective energy management and combines access to Qanteon, Qanteon Dashboard and Qanteon Insights for maximum efficiency and reduced costs and CO₂ emissions.
Qanteon Insights
Simple energy optimization with Qanteon Insights

With its user-friendly, web-based interface, Qanteon Insights provides innovative support for energy management in commercial, industrial and institutional buildings. This allows users to optimize energy use in their system operations in no time.
Users can use Insights to create and modify evaluations and reports according to their individual requirements. The embedded export functions for Office programs like Excel and PowerPoint and the file format PDF ensure easy further processing and the highest level of user comfort.
With the new EMS reporting and analysis functions of Qanteon Insights, you can process all your important data even more efficiently. You can refine your energy management processes and help prevent climate change by reducing CO₂. Insights, an important component in Kieback&Peter’s CO₂ roadmap, makes monitoring and analyzing CO₂ emissions child’s play.
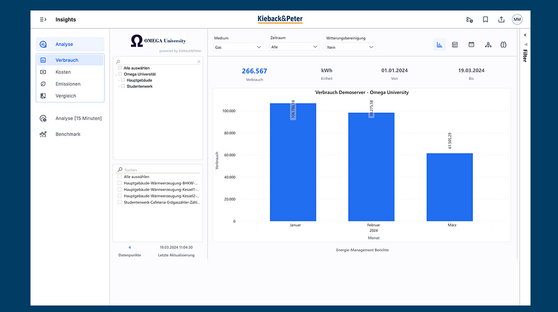
Insights offers graphical and tabular presentation, analysis and comparison of consumption, costs and emissions down to the day. In the fine analysis, which features 15-minute increments, Insights provides detailed insights through heat maps, load peak analyses and simulations of performance limits. To achieve planning security, users can create consumption and cost forecasts for the current year. Companies, institutions and organizations can use Qanteon Insights’ benchmarking functions to quickly and easily compare their consumption or energy requirements with industry standards or internal goals.
>>
Qanteon Insights makes simple energy optimization possible through individually customizable evaluations and reports, as well as detailed analysis functions. It also helps reduce CO₂ and provides benchmarking for effective energy management.
Qanteon Dashboard
On the path to sustainability with Qanteon Dashboard

Qanteon Dashboard from Kieback&Peter gives companies maximum control of their energy consumption, expenses and emissions. The new web-based application presents selected energy data at a glance and thus provides a complete overview of the most important key figures. You can import benchmark dashboards created in Qanteon and modify them to suit your corporate design by inserting your company logo.
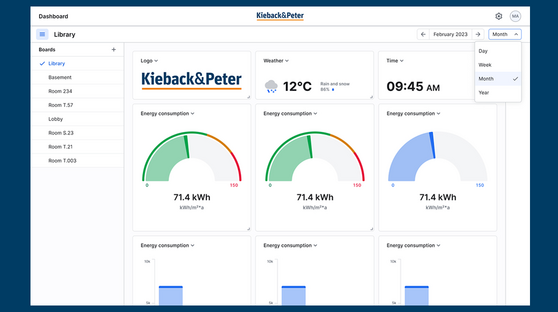
The new service in the Qanteon user journey, which can be reached through Qanteon Hub with just one click, is the central location where you can prepare and monitor your consumption data in a clear manner. The data is displayed in widgets (weather, time and logo widgets) whose arrangement, sequence and size you can modify individually at any time. Kieback&Peter is planning additional configuration options for customization.
>>
Qanteon Dashboard from Kieback&Peter presents selected energy data at a glance and provides a complete overview of the most important key figures.

- High-efficiency meter reading recording
- Effective meter detection with QR codes and NFC tags
- Replace meters with ease
